
Meta Data Science

When we practice data science, even if we've done everything correctly and in an unbiased manner, how do we know that our message has been correctly and fully received?
Every human communication goes through a "noisy channel" as illustrated below (image is from idealliance.org).
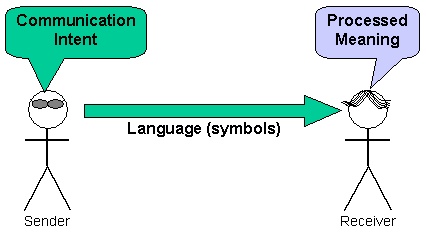
Well, it is possible to conduct experiments to verify how well our message is received. I.e., we can do data science on our data science efforts, or Meta Data Science.
Forbes this past week had a story on a study comparing prose with graphics with what I call the Dale Carnegie method. I was sure the Carnegie method (How to Win Friends and Influence People) would win out, but it turns out it's including a graphical visualization in one's report!
So now we have evidence that our data science reports should include visualizations -- it's no longer just a hunch, or a tip from a data science instructor (or blog :-)
That's a first step, but we can go further. Color blindness, for example, can affect how many are able to consume our visualizations (and how well). Dundas has some excellent visualizations (Meta visualization, if you will) on what percentage of the population can distinguish which sections of the color wheel.
An in-depth but easily readable 2004 publication Information Visualization: Perception for Design explicitly establish a "Science of Data Visualization" and delves deep into topics such as symbol choice, color choice, and differences in perception based on culture.
Analyzing data isn't all there is to Data Science. And it's not just analyzing + reporting either. It's analyzing + reporting + communicating, where communicating means getting your message understood. As data scientists, we can and should be employing the tools of data science to ensure our data science messages are getting understood.</p>