Standard Methodology for Analytical Models

Summary
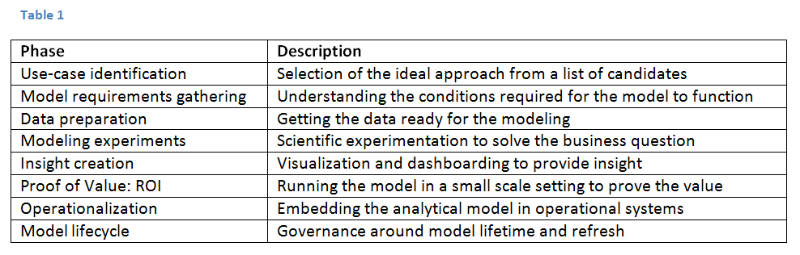
In this document, the Standard Methodology for Analytical Models (SMAM) is described. A short overview of the SMAM phases can be found in Table 1. The most frequent used methodology is the Cross Industrial Standard Processes for Data Mining (CRISP-DM)[1], which has several shortcomings that translate into frequent friction points with the business when practitioners start building analytical models.
The document will start with a discussion of the phases of the CRISP-DM and highlight its shortcomings. Subsequently, the phases of the SMAM will be described. A set of tables is provided that can serve as guidance to define the creation of a new analytical model.
Introduction
In the recent decades, the creation and use of analytical models has become common good in every industry. Analytical models have greatly evolved both in the depths of the mathematical techniques as well as the wide-spread application of the results. The methodology to create analytical models, however, is not well described, as can be seen by the fact that the job of the analytic practitioners (currently called data scientists; older names are statistician, data analyst and data miner) involve a lot of tacit knowledge, practical knowledge not easily reducible to articulated rules[2]. This informality can be seen in many areas of analytical modeling, ranging from the project methodology, the creation of the modeling & validation data, the analytical model-building approaches to model reporting. The focus of this document is project methodology.
The best known project methodology for analytical processes is Cross Industrial Standard Processes for Data Mining (CRISP-DM)[1]. This methodology describes six phases that show an iterative approach to the development of analytical models. Although it describes the general approach to analytical model creation (Business understanding, Data understanding, Data preparation, Modeling, Evaluation, Deployment), it lacks nuances that describe how analytical model building in a business context actually flows as an end-to-end process. The effects of the shortcomings of CRISP-DM translate into multiple friction points with the business when practitioners start building analytical models.
Shortcomings of the current methodology
Examples of these friction points will be well recognized by data scientists. Not limited to the set of examples given, friction points for the various phases include:
CRISP-DM: Business Understanding
Phase definition: this initial phase focuses on understanding the project objectives and requirements from a business perspective, and then converting this knowledge into a data mining problem definition, and a preliminary plan designed to achieve the objectives[3].
Issues: this view is often understood as only the data scientist who needs to understand the business issues while the business knowing exactly what they want. In reality, often the business intends to ‘make smarter decisions by using data’, but they lack the understanding of what analytical models are, how they can or should be used and what realistic expectations are around model effectiveness. As such, the business itself needs to transform in order to work with analytical models.
Another issue with the Business Understanding phase is that project objectives and project requirements are usually originating from different parts of the organization. The objectives typically come from a higher management level than the requirements and ignoring this fact, not seldom leads to the situation where after the model has been developed, the end-users of the analytical model are required to post-rationalize the model, which leads to a lot of dissatisfaction.
CRISP-DM: Modeling
Phase definition: in this phase, various modeling techniques are selected and applied, and their parameters are calibrated to optimal values3.
Issues: although this definition gives room for trying out different techniques, it very much underestimates the amount real experimentation that is needed to get at viable results, especially if a use-case if not a common, well-known one. True experimentation may require changing to an entire different format of the data, or even a different interpretation or adjustment of the business question.
CRISP-DM: Evaluation
Phase definition: at this stage in the project, you have built a model that appears to have high quality, from a data analysis perspective. Before proceeding to final deployment of the model, it is important to more thoroughly evaluate the model, and review the steps executed to construct the model, to be certain it properly achieves the business objectives[3].
Issue: thorough evaluation indeed is needed, yet the CRISP-DM methodology does not prescribe how to do this. As a result, evaluation is done on historic data, in the worst case, on a hold-out partition of the training data, in a slightly better case, on an out-of-time validation sample. As a model typically impacts an important part of the business, it is a good practice to device a proper experiment, whereby the model is tested in a limited fashion on new data. A proper experiment will also include an ROI calculation, which can be used to decide if the model is good enough to be implemented. Model evaluations often result in wry discussions with the business, who invariably expects analytical models to be accurate for 90% and up, irrespective of, and not bothered by the specific measure of accuracy. A limited experimental setting resulting in an ROI computation can help change this discussion to a more productive one.
Commonly, another issue with the evaluation phase is the lack of verbosity of the analytical model for the parties involved. One of the 9 laws of data mining states that ‘Data mining amplifies perception in the business domain’[4]. This very fact seems to urge that (lasting) visualization and dashboards reporting need to be integral part of the model building output. This concerns both what the model does (analytical reporting) as well as how the model impacts the business (operational reporting).
CRISP-DM: Deployment
Phase definition: depending on the requirements, the deployment phase can be as simple as generating a report or as complex as implementing a repeatable data scoring[3].
Issues: besides that fact that the deployment of the model needs to be discussed very much at the identification of the use-case (considering the availability and timing of scoring data and the costs of integration), the view of a single deployment phase is too simplistic. The deployment itself involves multiple phases, and needs to be defined using its own hand-over process, as this is the moment where the data scientists hands-over the resulting model to IT or an operational team who will ensure continuous execution of the model. In addition, the life cycle of the model needs to be taken into account, both from a model effectiveness perspective as well as from a model evolution perspective.
Standard Methodology for Analytical Models
In the previous paragraphs, the short comings of the CRISP-DM were discussed, whereby the issues raised are the reversed view of the improvements made in the Standard Methodology for Analytical Models (SMAM). The phases of the SMAM are as follows:
Use-case identification
The use-case identification phase describes the brainstorming/discovery process of looking at the different areas where models may be applicable. It involves education of the business parties involved on what analytical modeling is, what realistic expectations are from the various approaches and how models can be leveraged in the business. Discussions on the use-case identification involve topics around data availability, model integration complexity, analytical model complexity and model impact on the business. From a list of identified use-cases in an area, the one with the best ranking on above mentioned criteria should be considered for implementation. Note that, businesses often are not familiar with this very first data/fact based funneling step, and as a result, they will have to let go of their religiously held initial –and much to complex- analytic modeling idea. Parties involved in this phase are (higher) management, to ensure the right goal setting, IT for data availability, the involved department for model relevance checking and the data scientists to infuse the analytical knowledge and creative analytical idea provisioning. The result of this phase is a choses use-case, and potentially a roadmap with the other considered initiatives on a timeline.
Model requirements gathering
The use-case requirements gathering phase describes the process where for the chosen use-case, the set of conditions are explored that need to hold for the model to be viable in the business process. A not exhaustive list of topics of discussion are conditions for the cases/customers/entities considered for scoring, side-conditions that need to hold, consistency checks that need to hold, handling of unexpected predictions, or unexpected input data, requirements about the availability of the scores, the timing of scores (and the data), the frequency of refresh of the scores; initial ideas around model reporting can be explored and finally, ways that the end-users would like to consume the results of the analytical models. Parties involved in this phase are people from the involved department(s), the end-users and the data scientists. The result of this phase is a requirements document.
Data preparation
In the data preparation phase, the discussions revolve around data access, data location, data understanding, data validation, and creation of the modeling data. It is needed to create an understanding of the operational data required for scoring, both from an availability (cost) and timing perspective. This is a phase where IT/data administrators/DBA’s closely work together with the data scientist to help prepare the data in a format consumable by the data scientist. The process is agile; the data scientist tries out various approaches on smaller sets and then may ask IT to perform the required transformation in large. As with the CRISP-DM, the previous phase, this phase and the next happen in that order, but often jump back and forth. The involved parties are IT/data administrators/DBA/data modelers and data scientists. The end of this phase is not so clearly defined. One could argue that the results of this phase should be the data scientist being convinced that with the data available, a model is viable, as well as the scoring of the model in the operational environment.
Modeling experiments
In the modeling experiment phase, the core data scientist is at his/her element. This is where they can play with the data; crack the nut; trying to come up with the solution that is both cool, elegant and working. Results are not immediate; progress is obtained by evolution and by patiently collecting insights to put them together in an ever evolving model. At times, the solution at hand may not look viable anymore, and an entire different angle needs to be explored, seemingly starting from scratch. It is important to set the right expectations for this phase. There is no free lunch for the data scientist, although the business always seems to think so. The term data science[5] does honor to what is being done here: it is scientific research, with all its struggles, its Eureka’s, and its need for meticulous experimentation. The topic of the research: data, and hence the fitting term: data science. The data scientist may need to connect to end-user to validate initial results, or to have discussion to get ideas which can be translated into testable hypotheses/model features. The result of this phase is an analytical model that is evaluated in the best possible way with the (historic) data available as well as a reporting of these facts.
Insight creation
Dashboards and visualization are critically important for the acceptance of the model by the business. In analytical aspiring companies, analytical models often are reported on by a very technical model report, at the birth of the model in a non-repeatable format. In more mature analytical practice, the modeling data is used for insight creation is a repeatable way. Topics of discussion in this phase are analytic reporting and operational reporting. Analytical reporting refers to any reporting on data where the outcome (of the analytical model) has already been observed. This data can then be used to understand the performance of the model and the evolution of performance over time. Creating structural analytic performance reports also pave the way for structural proper testing using control groups. Operational reporting refers to any reporting on the data where the outcome has not yet been observed. This data can be used to understand what the model predicts for the future in an aggregated sense and is used for monitoring purposes. For both types of reporting, insights are typically created by looking at behavior of subgroups as qualified by the model. By creating a structural reporting facility for the insights, it allows deeper insight in changing patterns that can be used by business users, as a ‘free’ addition to the repeated scoring of the analytical model. The involved parties are the end-users, the involved business department, potentially a reporting department and the data scientists. The result of this phase is a set of visualizations and dashboards that provide a clear view on the model effectiveness and provide business usable insights.
Proof of Value: ROI
Analytical models typically start as an experiment where, at the start of the project, the results cannot be guaranteed. Results depend on the quality of the data and the (unobservable) knowledge that the data contains about the phenomenon to be modeled, as well the quality of the data scientist, the time spent on the creation of the solution and the current state of the art of analytical models. As stated earlier, the business is not educated to think about the quality of analytical models in a technical way, nor should they necessarily get there. However, as the model impacts many business targets, the involved parties in the business need to be sure that they can trust the model (very concrete: their bonuses depend on their business performance, and hence the performance of the analytical model may determine their bonus). An accuracy of 90% seems to be a good target for an analytical model from business perspective, irrespective of the understanding of the measure of accuracy involved. Yet, the criteria influencing the quality of an analytical model are discussed above and cannot be commanded by the business. To jump out of this back-and-forth discussion, a proper experiment needs to be set up: in a limited fashion, the analytical model is applied to new data and the outcomes are measured in such a way that the result can be made financial. If the ROI is positive enough, the business will be convinced that they can trust the model; the model is proven to generalize well once more, and a decision can be made if the model should be deployed or not. Topics of discussion are around the setup of the experiment, control groups, measuring the model effectiveness, computation of the ROI and the success criteria. The people involved are the end-users, potentially the finance department, the IT department in order to provide the new data for the experiment and the data scientists. The result of this phase is a report on the experimental setup, the criteria around the measurements and the outcome.
Operationalization
The operationalization phase is not applicable to all models, although, the models that are most valuable are not one-time executions, but are embedded, repeatable scoring generators that the business can act upon. The operationalization is a phase where the data scientist closely works with the IT department. The model development took place in a relatively unstructured environment that gave the possibility to play with data and experiment with modeling approaches. Embedding an analytical model in the business means it migrates from this loosely defined environment to a location of rigor and structure. The discussions that the data scientist and the IT operator need to have, revolve around a hand-over process of the model. In addition, the IT operator needs to understand the data requirement of the model and needs to prepare the operational environment for this. The hand-over of a model to an operational team needs to come with an audit structure. If integration in end-user systems is required, programmers are involved, guided by the data scientist on the workings of the analytical model. Moreover, for the integration itself, an IT change process such as Agile[6] may be defined. The result of the initial part of this phase is a hand-over document where all parties involved agree on the coming process. The final result of this phase is a functional analytical model, that is, repeatable scores of the model are available to the business process in order help makes better decisions.
Model lifecycle
An analytical model in production will not be fit forever. Depending on how fast the business changes, the model performance degrades over time. The insight creation phase took care of the monitoring of this performance; the model life cycle phase defines what needs to happen. Generally, two types of model changes can happen: refresh and upgrade. In a model refresh, the model is trained with more recent data, leaving the model structurally untouched. The model upgrade is typically initiated by the availability of new data sources and the request from the business to improve model performance by the inclusion of the new sources. The involved parties are the end-users, the operational team that handles the model execution, the IT/data administrators/DBA for the new data and the data scientist. The result of this phase is, during the construction of the phase, a document describing the governance and agreement on the change processes around the model refresh/upgrades. On execution, the result is a model that is once more effective for the duration it lasts.
References
- Shearer C., The CRISP-DM model: the new blueprint for data mining, J Data Warehousing (2000); 5:13—22.
- Doing Data Science: Straight Talk from the Frontline, Rachel Schutt, Cathy O'Neil. O'Reilly Media, Inc. (2013), p359.
- http://en.wikipedia.org/wiki/Cross_Industry_Standard_Process_for_Data_Mining
- http://khabaza.codimension.net/index_files/9laws.htm
- http://en.wikipedia.org/wiki/Data_science
- http://en.wikipedia.org/wiki/Agile_software_development
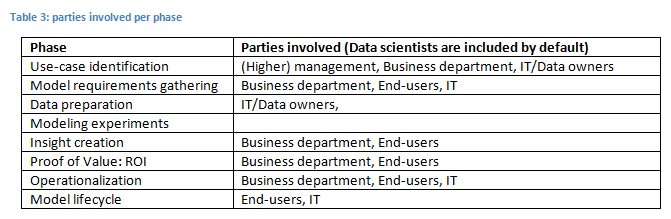
Summary of phases in tables
Below follows an overview in table format of the different phases.
A non-picture version of those tables is available at
http://olavlaudy.com/index.php?title=Standard_methodology_for_analytical_models